June Case-Shiller Report: Mixed Bag is Better than an Empty Bag
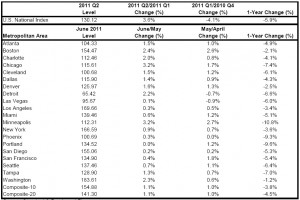
Yes, the second quarter 2011 Home Price Indices was down 5.9% over second quarter 2010, but second quarter 2011 was up 3.6% over first quarter 2011, and here’s some other good news to offset the fact that the real estate market is still struggling for true traction:
- In 19 of 20 metropolitan areas home prices were up in June 2011 vs May 2011 and Portland was flat – so no declines and an overall increase of 1.1%.
- 12 of the 20 metropolitan areas have increased for three consecutive months, a sign that there’s still strength in the seasonal housing market.
- No cities had new lows in June 2011.
- Only Detroit and Las Vegas have average home prices below January 2000 levels. Cleveland has shown enough improvement to rise above January 2000 levels with the June data in.
- June Detroit and Las Vegas average home prices did inch up from their May average prices though.
- San Francisco, San Diego, Los Angeles, Dallas, Denver and Washington DC hit their average pricing lows in 2009, but have remained above since.
As I said, the bag was mixed when June numbers came in, and here’s the not-so-good part of the mix:
- New average pricing lows were hit in 2011 in Las Vegas, Miami, Phoenix, Tampa and Detroit – the Sun Belt and Motor City are feeling the housing market heat.
- June 2011 average prices fell 4.5% from June 2010.
- Given the jobless rate and market instability to date in the third quarter there are reservations as to whether any positive trends will be able to maintain their second quarter momentum heading into the third quarter.
However, on the negative side of the bag, no declines in major indices can be directly tied to June 2011 or for that matter, the entire second quarter of 2011. Currently, it’s the first quarter 2011 numbers that are the heaviest weight on the negative side of the bag, and it’s the first quarter that’s dragging the entire year down.
Micro / Macro
Micro – Over the last several months, the Case-Shiller report has shown positive signs of improvement. Even this June we saw home prices up an average of 1.1% This is a positive trend.
Macro – Taking a few steps back, home prices are down 4.5% from a year ago. But we know they were still falling. But in order to increase there must be a turning point and this is looking like it.
So how is Steamboat Springs, Colorado fairing in comparison – well, the mixed bag is evident in Steamboat as well with June ‘11 total dollar volume up 11.38% over June ’10, but July total dollar volume down 14.35% over July ’10.
The bag is not empty though. As of this writing, there are 69 residential pending sale units (single family, condos and townhomes) and 14 of those are for $1M+. So one in 5 (20%) of our upcoming closings are for $1M plus residential properties as of today. Looking at the bag as half full, that’s a lot better than none of them being million dollar sales and above.
Clearly no one is declaring the real estate market in recovery right now, but there are signs that point to a leveling out or as I said ealier, we are bouncing along the bottom. How long “level” is the new norm remains to be seen, but where mixed bags are concerned, it’s a lot easier to carry a level load over time than an unbalanced load…especially an unbalanced load that’s on its way down.


Links
Steamboat Areas
Popular Searches
Broker Associate
Popular Searches
Didn't find what you were looking for?