Steamboat Springs Year-End Real Estate Report

Routt County Real Estate Analysis
December was a good month and a great way to end 2015. There were 142 transactions for $99.2M in gross volume. That’s up by +70% compared to December 2014. Transactions were up by +17% from December 2014.
In total for 2015, there was $700,083,935 in gross sales (up 17% over 2014) and 1,457 Transactions (up +7% over 2014) Total sales were the highest it’s been since 2008.
-
2008 = $725M
-
2009 = $439M
-
2010 = $512M
-
2011 = $450M
-
2012 = $483M
-
2013 = $503M
-
2014 = $598M
-
2015 = $700M
|
|
|||||
|
Price Point |
# of transactions |
% of transactions |
2014% of transactions |
% of volume |
2014 % of volume |
|
Under $500K |
580 |
65% |
62% |
33% |
29% |
|
$500,001 – $1M |
224 |
25% |
26% |
29% |
34% |
|
$1M – $3M |
84 |
9% |
11% |
29% |
27% |
|
Over $3M |
8 |
1% |
1% |
9% |
10% |
So who is buying Steamboat Springs real estate?
2015 Buyers:
- Local buyers = 49%
- Front Range buyers = 12%
- Out of State buyers = 38%
- International buyers = 0%
Average Price Per Square Foot for 2015:
- Fish Creek area = $274 (2014 = $263)
- Downtown area = $356 (2014 = $335)
- Mountain area = $302 (2014 = $286)
- Strawberry Park area = $506 (2014 = $527)
- Catamount = $561 (2014 = $456)
- North Routt = $254 (2014 = $262)
- South Routt = $374 (2014 = $285)
See 2015 Routt County Real Estate Numbers Here
National Real Estate Market
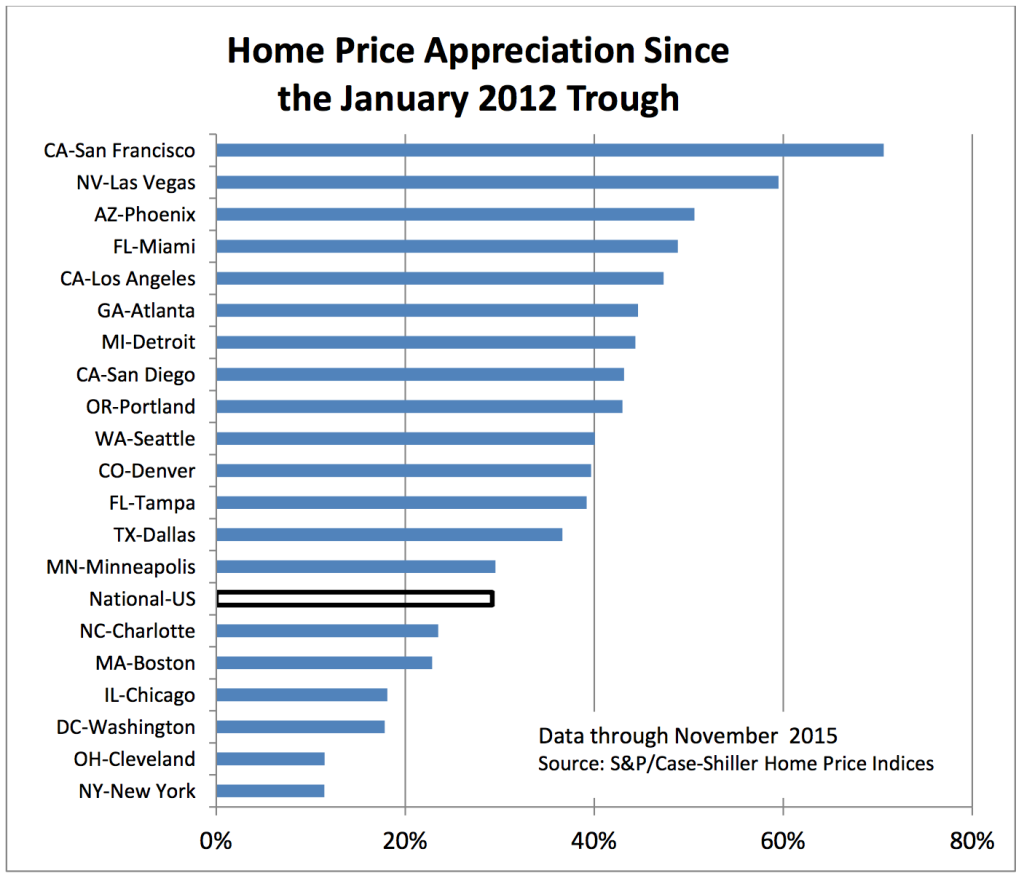
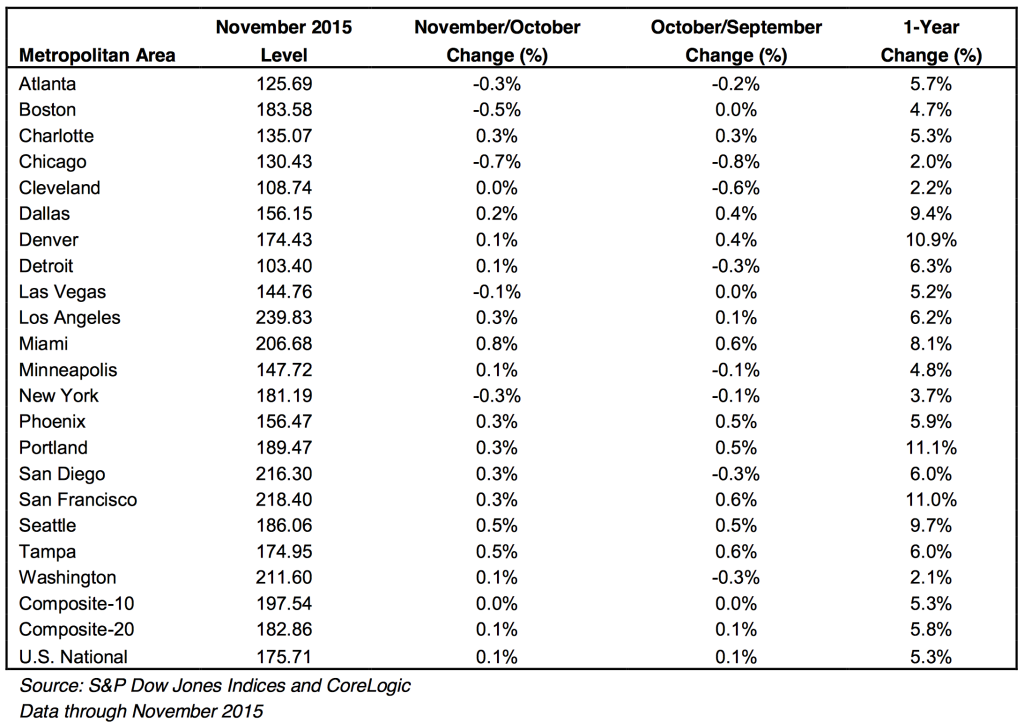
Sales of existing homes were up 6.5% in 2015 vs. 2014, and the number of homes on the market averaged about a 4.8 months’ supply during the year; both numbers suggest a seller’s market.
Here’s to a great ski season and another healthy real estate market in Steamboat.
Regards,
Charlie


Links
Steamboat Areas
Popular Searches
Broker Associate
Popular Searches
Didn't find what you were looking for?