Steamboat Springs, CO Real Estate Report
Memorial Day has just passed and the summer has officially begun! There is lots happening in Steamboat Springs this month including the Yampa River Festival, Bike Week and the Rocky Mountain Mustang Roundup, yee haw! Check out the Steamboat Springs Chamber Resort Association’s calendar of events to see whats happening.

Routt County Real Estate Analysis
Gross sales for April totaled $56.2M, up 44.32% compared to April 2015. This comprised of 114 transactions, an increase of 1.79% compared to the same period last year. The summer selling period is about to really heat up! In the past month there has been more than 250 new properties hit the market in anticipation of summer buyers. And if the pending figures are telling us something, they might just be right – there are 223 properties currently pending sale at the end of May. Of the April sales, the majority were in the under $500,000 bracket and there is still limited supply and strong demand for this segment of the market.
|
|
|||||
|
Price Point |
# of transactions |
% of transactions |
Previous month % of transactions |
% of gross volume |
Previous month % of gross volume |
|
Under $500K |
48 |
61% |
73% |
36% |
43% |
|
$500,001 – $1M |
27 |
34% |
17% |
48% |
27% |
|
$1M – $3M |
4 |
5% |
10% |
16% |
30% |
|
Over $3M |
0 |
% |
0% |
0% |
0% |
This chart notes single family and multi family residential sales, 79 total transactions for the month of April. Not shown here are the 14 timeshare transactions, 9 land, 5 commercial and 7 miscellaneous transactions for a total of 114 transactions. There were 2 bank sales during April.
View full April 2016 Routt County market statistics here
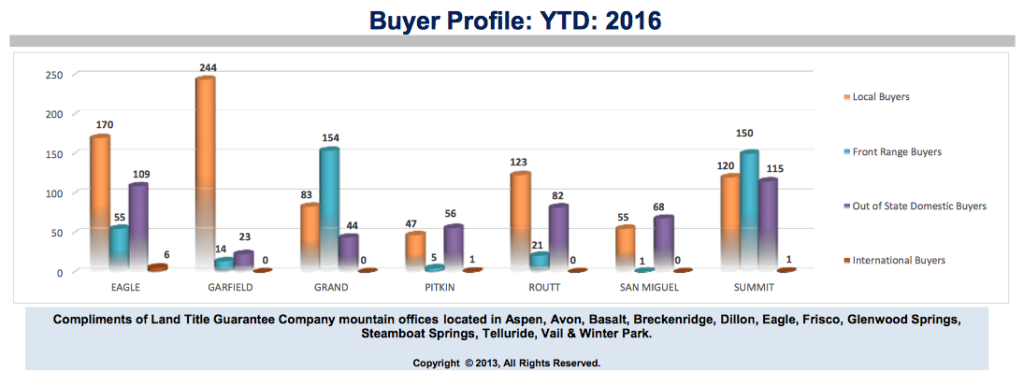
Interested in how Routt County real estate is doing compared to other Colorado mountain communities? Click here for the comprehensive Q1 2016 report.

National Real Estate Market
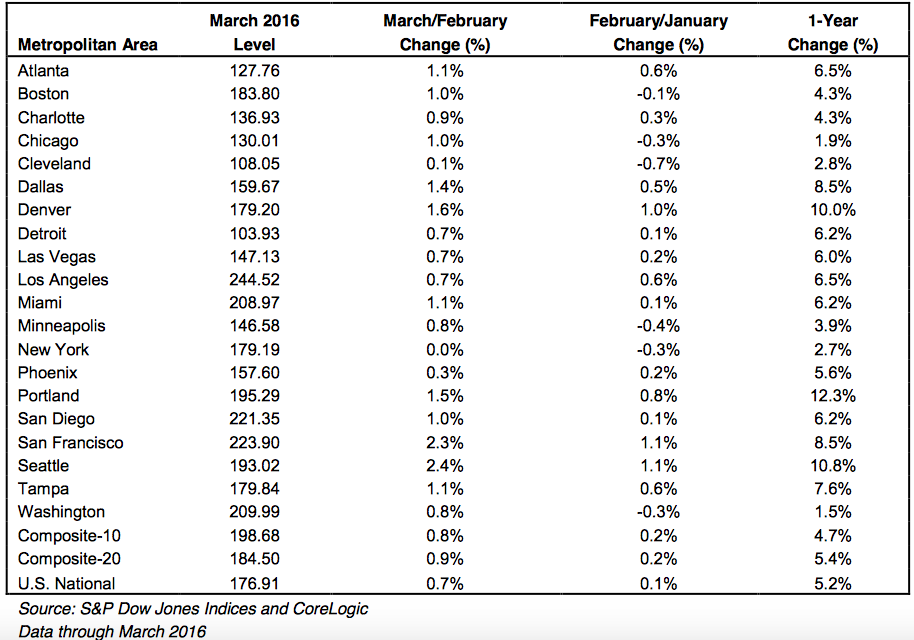
The May 31st S&P Case-Shiller Home Prices Index release showed that national home price appreciation remained strong in March 2016, matching the previous month’s year over year grains. The 20-city composite year over year gains was unchanged from the previous month at 5.4%. The current figures show the strong correlation between unemployment rates and home prices as David M. Blitzer, Managing Director & Chairman of the Index Committee at S&P Dow Jones Indices discusses: “The economy is supporting the price increases with improving labor markets, falling unemployment rates and extremely low mortgage rates.”
He also notes that “Seattle, Portland, Oregon and Denver had the largest year-over-year price increases. These cities also saw some of the largest declines in unemployment rates among the 20 cities included in the S&P/Case-Shiller Indices. The northeast and upper mid-west regions were at the other end of the ranking. The four cities with the smallest year-over-year prices gains were Washington DC, Chicago, New York, and Cleveland. The unemployment rates in Chicago and Cleveland rose from March 2015 to March 2016.”
Another perspective of the national housing market by the Wall Street Journal can be found here.
Regards,
Charlie
Want to learn more about me?
Charlie Dresen
Real Estate Associate Broker |Sotheby’s
Change Your Experience
970-846-6435 | SteamboatsMyHome.com
Charlie@SteamboatsMyHome.com


Links
Steamboat Areas
Popular Searches
Broker Associate
Popular Searches
Didn't find what you were looking for?